Diversity and influx of residents shifting voter registrations
Roseville, Calif. – Placer County voter registration data shows that during the reporting period of June 2020 to July 2021, over 25,000 new voters registered countywide. With the influx of new residents, Placer County has recorded nearly 55,000 new voter registrations over the past three years. In perspective, that’s twenty percent of all county voters have registered in just the last three years.
In raw numbers, Democrats garnered the largest gains with 9,267 new registrations. Republican garnered 7,928 new registrations. No Party Preference added 4,044.
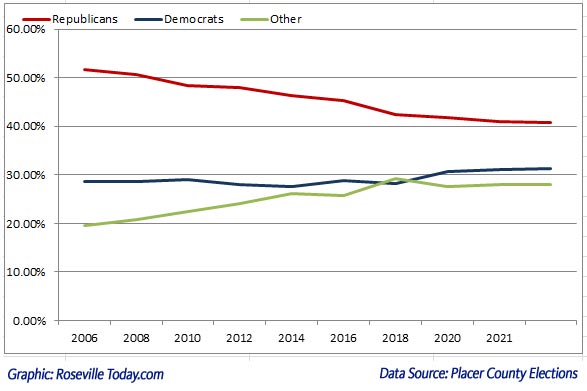
Voter registration (2006-2021)

Republicans continue to lag all parties
While Republican registrations still maintain a sizable lead over Democrats, the gap continues to shrink from a whopping 23 percent in 2006, to 9.83 percent today. In terms of percentages, Independents and other third parties have seen the largest percentage gains, however, their total registrations remain very low in Placer County. No Party preference garners about 20 percent of registrations.
In 2006, Placer County Republicans commanded 51.70 percent of registrations, while Democrats held just 28.69 percent. Fast forward to July 2021 and Republicans hold 40.91 percent, while Democrats hold 31.08 percent. See Placer County’s Shifting Electorate as reported here.
Despite the fluctuations and decline in party voter registration, Placer County has consistently voted Republican. In the last two presidential elections, the margins have continued to drop.
As Placer County continues to grow, diversify and prosper, it is projected to shift political direction over the next couple decades to reflect the majority of California voters similar to Orange County’s switch.
Placer County Voter Registration Gains (June 2020 – Sept 2021)
| Party | Net Gain | % Gain |
|---|---|---|
| Republicans | 7,928 | 7.57% |
| Democrats | 9,267 | 12.13% |
| No Party Preference | 4,044 | 7.69% |
| Independents | 2,257 | 26.37% |
| Libertarians | 762 | 18.20% |
| Green | 125 | 15.28% |
| Peace & Freedom | 130 | 23.72% |
| Other | 693 | 28.83% |
Placer County Voting Record
Presidential 2004
R 62.47% (margin ~40,000 / 26%)
D 36.17%
Presidential 2008
R 54.45% (margin ~19,500 / 11.2%)
D 43.21%
Presidential 2012
R 58.19% (margin ~33,000 / 19%)
D 38.91%
Presidential 2016
R 51.14% (margin ~21,500 / 11.6%)
D 39.52%
Presidential 2020
R 52.10% (margin ~15,000 / 6.5%)
D 45.46%
Gubernatorial Recall Election 2021
YES to remove Governor 57.39% (margin ~29,734 / 14.78%)
NO to keep Governor 42.61%
Related
(21+ years strong)
Welcome to the brighter side!
Get in front of local customers! 24/7 (365)


